
How can we assess the California legislature’s productivity? At Plural, we are constantly analyzing, manipulating, and learning from our data. Recently, our data insights team embarked on a project to find patterns in the troves of legislative data in our database. Our team then provided insight and guidance on the four most interesting or useful patterns. The following is the second in a series of four blogs digging into this work. The first blog in the series can be found here.
How Many Bills Do California Legislators Introduce, Vote On, and Pass in Each Legislative Session?
Each legislative session in California produces a massive amount of legislative text. By the end of the two-year session, those monitoring the legislature will likely have read thousands of bills. Some bills will have died in committee, while others made it all the way to a final vote. In the moment, though, the drama of each session can make an interested party think the current activity is unprecedented.
We’ve used our data to examine the past 15 years of legislative activity in California. In particular, we examined whether there were significant swings in the legislature’s productivity or divisiveness. To do this, we looked at:
- The total number of introduced bills
- The number of bills that appeared for a final passage vote
- The number of bills successfully passed by the legislature
2007-2022 Bills Introduced, Appearing for Final Passage, and Passed in the California State Legislature
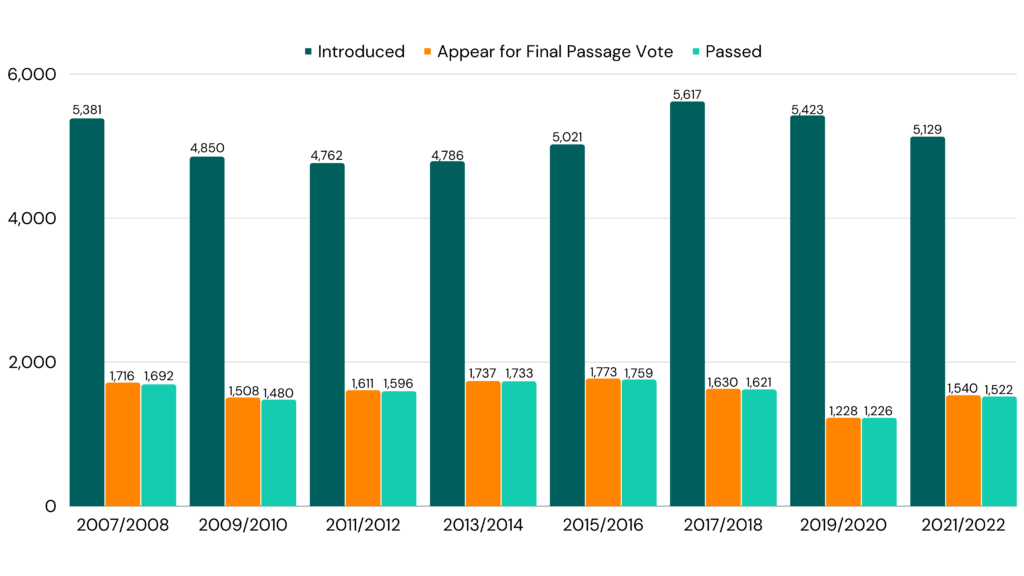
In this analysis, two findings struck us as particularly interesting. First, while the number of bills introduced is relatively static, the number of bills appearing for final passage and passing is trending downwards. This trend can be seen even more clearly if we look at the percentage of introduced bills that passed across sessions.
2007-2022 Percentage of Introduced Bills that Pass
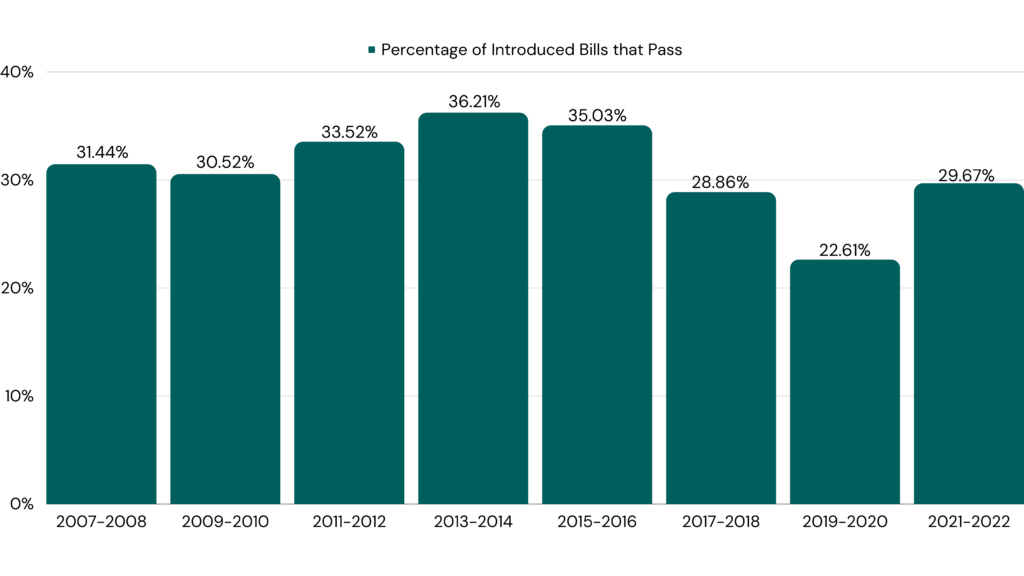
The years in which the number of bills introduced was lowest, 2009-2016, were also when legislators passed a higher proportion of bills. It’s difficult to isolate one reason for a trend, and we won’t attempt to. We’ll return to this dataset following the 2023-2024 session to see if this trend continued, or even accelerated.
The second interesting finding was the consistency of the rate at which bills that appear for a final passage do indeed pass. In other words, most bills that appear for a final vote end up becoming law. Of course, in order to appear for a final passage, bills must be approved by multiple legislative committees and a whole chamber. While it shouldn’t necessarily be surprising that the bills that make it through the full legislative process have robust support, we did not expect the rate of passage to be quite so high.
2007-2022 Percentage of Bills Appearing for Final Passage that Pass
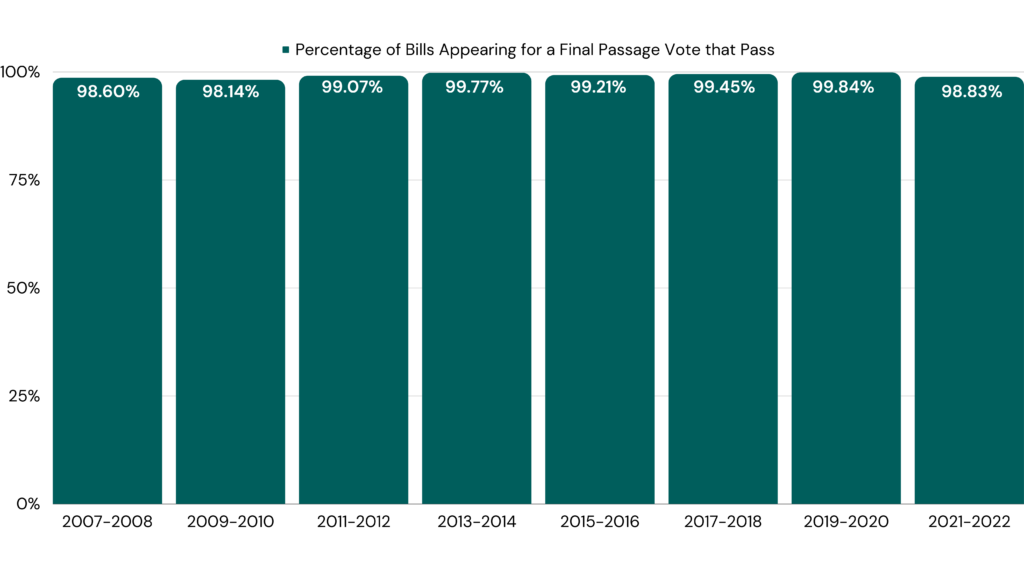
Again, the fact that most bills that make it to a third reading in their second chamber pass is unsurprising. But, the magnitude and consistency of these passage rates can help inform models that determine the viability of a bill. It would also be interesting to compare California’s rate of passage to a state with a more even partisan split, to see if a more divided legislature has lower passage rates.
Using Data to Understand Legislative Activity
Zooming out and looking for patterns in legislative data can help you better understand legislative processes you already thought you knew well. Understanding a legislature’s activity, productivity, and progress requires some contextual knowledge. However, examining data at a higher level can benefit those hoping to better understand a legislature’s activity.
Get Started with Plural
Interested in seeing how Plural can deepen your legislative insights? Get started today!