
At Plural, we are constantly analyzing, manipulating, and learning from our data. Recently, our data insights team embarked on a project to find patterns in the troves of legislative data in our database. Our team then provided insight and guidance on the four most interesting or useful patterns. The following is the fourth in a series of four blogs digging into this work. The first blog in the series can be found here, the second can be found here, and the third here.
Key Topics in the California Legislature
Our research has highlighted the remarkable consistency of California’s legislature. Across sessions, the CA legislature is very consistent when it comes to activity, passage rates, number of bills passed, and time to passage. General information about the legislative process can be helpful for those predicting or reacting to policy. For our final blog in this series, we wanted to dig deeper. In this blog, we will go beyond the high-level of how legislators are acting, to look at what they are acting on.
We built and trained an AI model using Plural’s legislative datasets to categorize bills by their topics. Bills were assigned to 17 topic categories. We applied the model across two complete biennial sessions, 2019-2020 and 2021-2022, as well as the first half of the current biennium, 2023. Our analysis paints a picture of the legislative topics that attract the most activity in any given session.
Percent of Analyzed Bills within Each Topic Category, by Session (2019-2023)
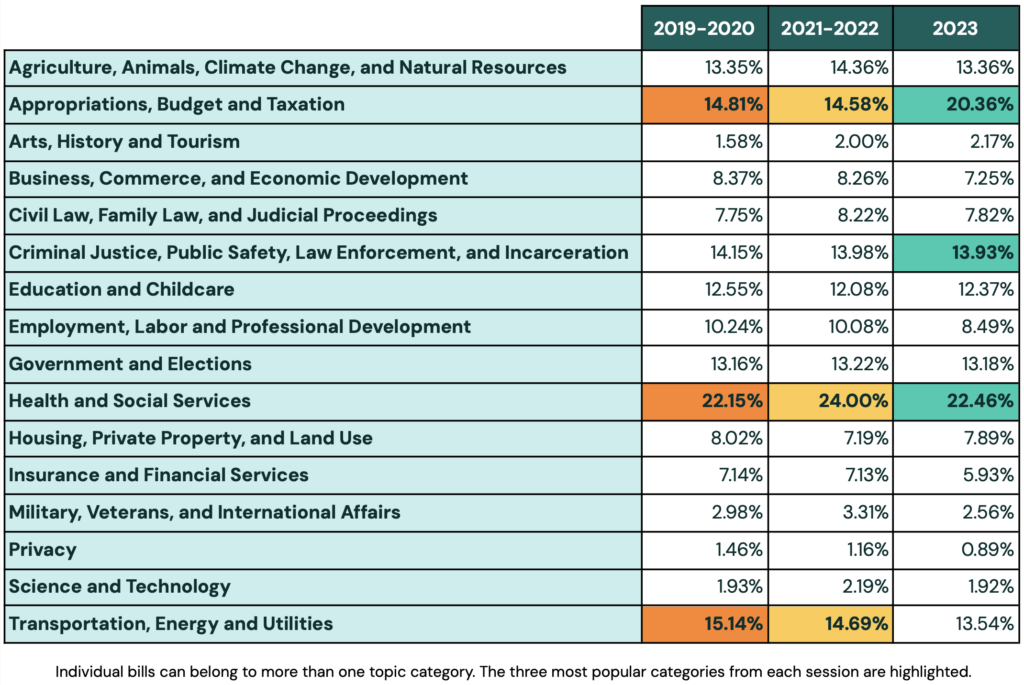
A few insights immediately jumped out to our team as we examined this data.
Over the biennium examined, the legislature focused on Health and Social Services far more than other topic categories. Health and Social Services is a broad category, far broader than privacy, for example. It includes everything from pandemic-related safety measures to Medi-Cal reimbursement rates. Beyond the wide scope of the subject matter, this is also an area that lawmakers often highlight as a priority. It’s unsurprising to see more than 1 in 5 bills logged into this category.
More than 20% of bills introduced in 2023 fell into the Appropriations, Budget and Taxation category. This is likely overweighted, as the first year in a biennium tends to have more appropriations legislation than the second year. Despite this, no other category comes close to the level of consistent focus on Health and Social Services.
Finally, looking at this data shows the value in expanding this type of dataset. Five years of legislative data from one jurisdiction can unlock a few insights. However, the real value could come from comparing across jurisdictions or across wider spans of time.
Analyzing California’s Legislative Activity
Our analyses of California’s legislative activity over the past fifteen years has produced many interesting insights. We’ve learned that:
- A majority of passage votes to come in August in September
- Most bills receiving final passage votes will indeed pass
- Most bills that become law have a 30-35 week lifespan between introduction and final passage
Continuing and expanding this type of analysis can help better understand legislative activity. It can also give us insights into how legislative activity compares across jurisdiction and time. Here at Plural, we’re committed to using our data to help our community of public policy experts deepen their legislative insights.
Get Started With Plural
With Plural, it’s easier than ever to get and stay ahead in the public policy landscape. Get started today to:
- Access superior public policy data
- Be the first to know about new bills and changes in bill status
- Streamline your day with seamless organization features
- Harness the power of AI to gain insights into individual bills and the entire legislative landscape
- Keep everyone on the same page with internal collaboration and external reporting all in one place