
At Plural, we are constantly analyzing, manipulating, and learning from our data. Recently, our data insights team embarked on a project to find patterns in the troves of legislative data in our database. Our team then provided insight and guidance on the four most interesting or useful patterns. The following is the third in a series of four blogs digging into this work. The first blog in the series can be found here and the second can be found here.
How Long Do Bills Take To Pass in California? How Much Activity Takes Place During That Time?
A core building block of education in public policy is an explanation of ‘how a bill becomes a law’. Resources range from Schoolhouse Rock songs, to flow charts prepared by legislative information offices.
Understanding the path a bill takes from introduction to passage is key to anticipating the work of state legislators. It takes on-the-ground experience to grasp what that path truly looks and feels like. Lobbyists and advocates with experience monitoring bills that pass, stall, or fail are often more effective.
Plural has a wealth of details about every bill that has passed or failed in California, over the last fifteen years. This data can unlock insights that improve our understanding of the road to passage, for current and future legislation. Below, we take a look at the typical timeline for a bill from introduction to its final vote in the legislature.
Average Number of Weeks Between Introduction and Passage Vote in the California Legislature, 2007-2022
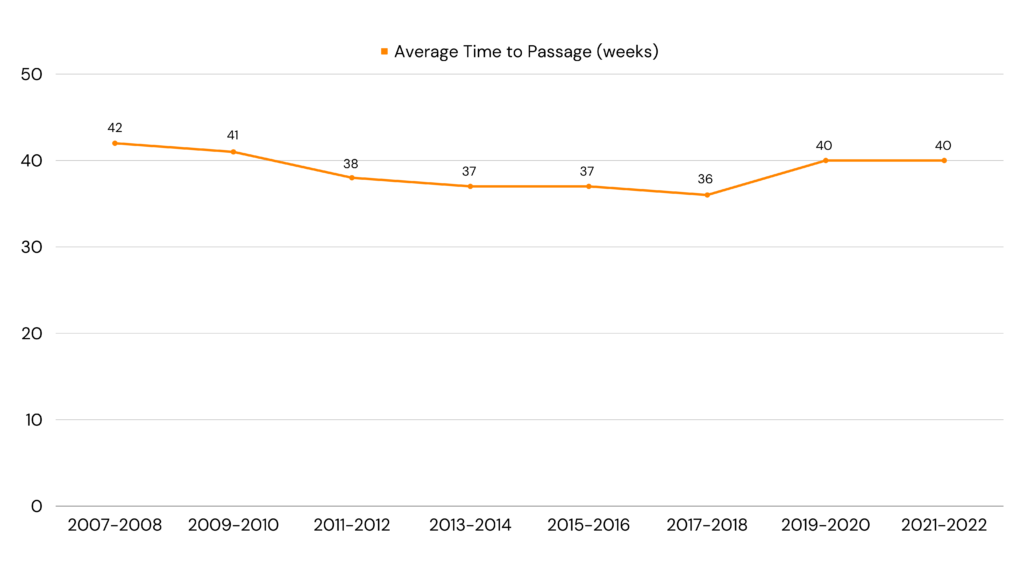
The chart above is best understood with a key piece of context: the CA legislature operates on a biennial calendar. For instance, this means that some bills introduced in early 2007 did not receive a passage vote until late 2008. These 2-year bills (with nearly 100 weeks of lifetime!) drag our average up, but the chart shows the consistency of this average across sessions. The table below provides a fuller picture of how long bills typically take to receive a passage vote.
Number of Weeks Between Introduction and a Passage Vote in the California Legislature, 2007-2022
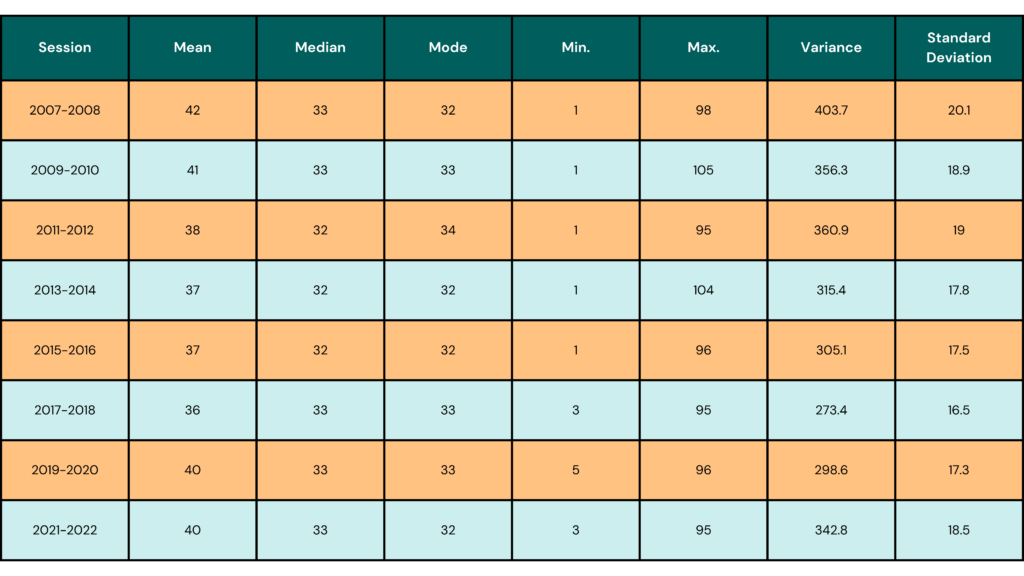
The averages shown in the chart above give us a picture of the consistency of the lifespan of a typical bill. This table grants us a better understanding of what this may mean for any individual bill.
The average weeks-to-passage for each legislative session is between 32 and 33 weeks. This aligns with what we learned in a previous blog.
The data we see here puts bills introduced in mid-January on a timeline to pass during the busiest part of the year, in late August and early September. This trend is consistent, holding across sessions, governorships, and turnover in the chambers. Lobbyists and advocates can use this data to map out their efforts to influence a bill on its way to passage over 8-9 months.
The minimum and maximum columns in the table remind us that there are always outliers. There’s always the possibility of a bill moving through to passage in one week (typically at the very end of a session,) or lasting across multiple sessions and nearly 100 weeks.
Explore More Free Public Policy Resources:

The Future of Lobbying: How Data, Technology & Policy Intelligence Are Reshaping Government Affairs
Relationships still win. But in a world where your counterpart may have already mapped the legislator’s voting history, tracked the coalition forming against your issue, and flagged the model bill moving in six other states, showing up unprepared in government affairs is a disadvantage. The government affairs profession is not changing because technology is replacing what lobbyists […]

AI Tools for Government Affairs: What Enterprise Teams Actually Need
If your team operates across dozens of states, inside a complex organization, with compliance and legal in the loop — you need something built to a different standard. The government affairs technology market has a categorization problem. When someone searches for “AI tools for lobbyists” or “digital tools for government affairs,” they get a mixed result set. Individual […]

Legislative Intelligence in the Enterprise: Why Manual Monitoring Is a Liability and What to Do Instead
The spreadsheet your team is using to track legislation isn’t just inefficient. It’s a documented risk to your compliance posture. Here’s why and what replaces it. Somewhere in your organization, there is a spreadsheet. It might be called “Legislative Tracker Q1” or “State Bills — Active” or something more creative. It lives in a shared drive. Someone updates it when they […]